Analyzing New USDA Data Using Open Source Tools

And how the Parquet file format can help.
Author

Michael Thomas

Published

August 13, 2023

A Big (Data) Release from the USDA

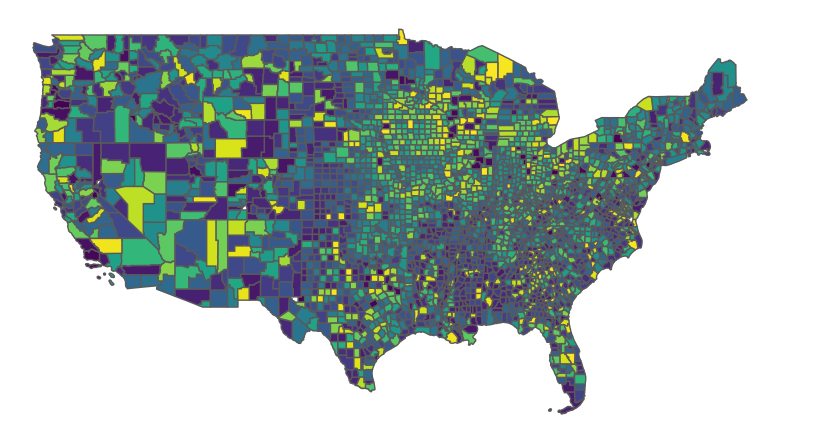
When the USDA released its Crop Sequence Boundaries (CSB) data set last month, we knew it was huge news. What we didn’t realize immediately, however, was that the data would also be huge. In fact, as we set out to explore how this dataset could be useful (particularly to our Farm Credit System clients), simply trying to read this data in both Python and R took hours before maxxing out the memory on our laptops, resulting in quite a few “BSOD”s.

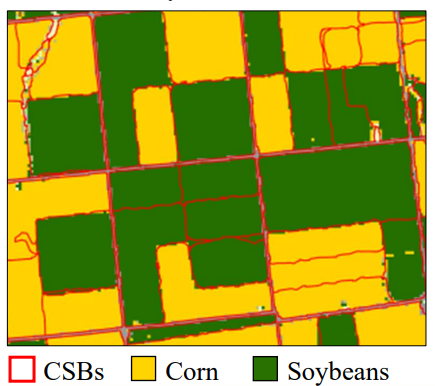
For some more background, the CSB dataset contains “…estimates of field boundaries, crop acreage, and crop rotations across the contiguous United States.” In a nutshell, it shows what is planted where, and how that has changed over time.

CSB data in action

After downloading the geodatabase files from the Datasets section of the CSB home page and failing to successfully read them into R or Python, we needed to come up with an alternative strategy to analyze the data in these files without running out of memory. We decided to try to get the data into a different file format than geodatabase (.gdb), and use the current cutting-edge file format: Parquet (pronounced “par-kay”).

Why Bother?

As a consulting firm that does a lot of work in the ag finance space, we are always trying to stay ahead of the curve and discover unique ways to provide value to our clients.

Crops are the primary output of (non-livestock) producers. Knowing what crops are planted where, and how the composition of those crops has changed over time may be useful for a few reasons:

  1. Marketing to existing customers or identifying prospective clients
  2. Evaluating concentration risk (is your ACA’s loan portfolio increasing/decreasing in its diversity of crops farmed?)
  3. Identifying crop rotation trends over time for capital/insurance planning purposes

To further level-set, the audience for this post is:

Analysts, data scientists and business intelligence folks working in the Farm Credit system.

Lastly, for every licensed product that Ketchbrook develops (such as our {KAscore} R package), we aim to provide one open source solution (such as our {migrate} R package, or this open CSB data)

Migrating to Parquet

We know that the geodatabase file format that our data comes in won’t work for local analysis. The CSB homepage recommends using ArcGIS to analyse the 19.5 million unique polygons within the data set, but we prefer to use open source software instead of pay-for-play tools.

Geoparquet is a newer file type that leverages the powerful Apache parquet columnar data storage format, which stores data in .parquet files for efficient loads, compresses well and decreases data size tremendously.

The goal of the Geoparquet project is for .parquet to become the new standard file format in the geospatial world, replacing the shapefile.

For our purposes, we want to be able to read those 19 million polygons in the CSB data into our R session, so we decided to convert the geodatabase file into partitioned .parquet files. After some research, we discovered that the {geopandas} Python package provides the ability to read in only a specified set of rows of the data from a .gdb file, instead of having to read the entire thing into memory. While this approach is admittedly somewhat crude, it was the best that we could come up with – and it worked!

Code
import geopandas as gpd

# Define path to the un-zipped .gdb file
gdb_path = "./National_Final_gdb/CSB1522.gdb"

# Define path to destination folder to land .parquet files
parquet_dest = "/some/folder/somewhere/"

# Read in "chunks" of the data from the .gdb file (1 million rows at a time), 
# and write the "chunks" out to separate .parquet files
row_start = 0
row_end = 1000000

# Write out every 1MM rows in the data from the .gsb file to a new .parquet file
# (this loop will work for up to 100MM rows of data; you could -- and probably 
# should -- do this in a `while` loop, instead)
for r in range(0, 100):
    print(f'Writing rows {row_start}:{row_end}')
    rows = slice(row_start, row_end)
    geo = gpd.read_file(gdb_path, rows=rows)
    # If there's no data in the data frame, exit the loop (don't write to .parquet)
    if len(geo) == 0:
        break
    else:
        path = parquet_dest + "csb_" + str(r) + ".parquet"
        geo.to_parquet(path=path)
        row_start = row_end + 1
        row_end = (r + 2) * 1000000

The last step involved reading in the new .parquet files and re-writing them out (to .parquet format again), this time partitioned by state, instead of by an arbitrary number of rows. By partitioning (i.e., creating separate .parquet files for each “partition”) the data this way, we can reap huge performance gains when reading the data into memory. Also, we imagine that end users of this data will likely be interested in analyzing crop sequence boundaries for a few particular states. Partitioning the data by state will lead to additional performance improvements, since only the .parquet files for the state(s) of interest will need to be computed on. We decided to switch to R for this step (and for the rest of the analysis).

Code
# Establish an {arrow} connection to the .parquet files partitioned every 1MM rows,
# and re-write the data out to .parquet files partitioned by STATEFIPS code (State)
arrow::open_dataset("/some/folder/somewhere/") |> 
  arrow::write_dataset(
    path = "/some/other_folder/somewhere/",
    partitioning = "STATEFIPS",
    format = "parquet"
  )
You can use this dataset!

Ketchbrook Analytics has made this optimized geoparquet dataset available to the public, via an AWS s3 Bucket. Currently, we have only hosted the most recent CSB data (which contains an eight-year history of crop sequence boundaries, as of 2022), but we plan to migrate the additional (older) data to s3 soon.

Now that the re-partitioned Parquet data has been made available in AWS, we can establish a connection between R and the s3 bucket. From there, we can list the first few files in the bucket.

Code
library(arrow)
library(stringr)

# Establish a connection to the AWS s3 bucket
bucket <- arrow::s3_bucket("ketchbrook-public-usda-nass-csb")

# List the paths to the first few .parquet files in the `year=2022` directory
bucket$ls(path = "year=2022", recursive = TRUE) |> 
    stringr::str_subset(pattern = ".parquet$") |> 
    head()
[1] "year=2022/STATEFIPS=01/part-0.parquet"
[2] "year=2022/STATEFIPS=04/part-0.parquet"
[3] "year=2022/STATEFIPS=05/part-0.parquet"
[4] "year=2022/STATEFIPS=06/part-0.parquet"
[5] "year=2022/STATEFIPS=08/part-0.parquet"
[6] "year=2022/STATEFIPS=09/part-0.parquet"

Note that the files themselves are all named part-0.parquet, but the folder paths indicate the year and state (FIPS code) of the data in the corresponding file.

When Lazy Becomes Efficient

Before actually reading in the data from the s3 bucket, we should first discuss best practices for working with these types of files.

First, let’s get lazy (in the good way). When we combine the underlying Arrow specification behind Parquet with R’s dplyr functions, we can take advantage of lazy evaluation. Lazy evaluation simply means that we build a recipe of what we want to do with the data set, but we only apply the recipe when we are ready to bring the transformed data into memory. In other words, we can filter our data set (on disk) by state, county, acreage, etc., before bringing it into our R environment.

Data Preparation

Let’s take our first peek at the data to see what we’re dealing with. However, instead of pulling in all of the data from the s3 bucket, let’s only pull in data from Hartford County, Connecticut.

Note that the sfarrow package lets us parse our Parquet data directly into the popular geospatial sf object format. This will help us build maps and perform geospatial calculations downstream.

Code
library(sfarrow)
library(dplyr)

# This code should only take a few seconds to run -- try it yourself!
raw <- arrow::open_dataset(bucket) |>
  dplyr::filter(STATEFIPS == 9) |>  # Connecticut
  dplyr::filter(CNTYFIPS == "003") |>  # Hartford county
  sfarrow::read_sf_dataset()  # interpret `geometry` column as an `sf` object

# List the columns, types, and first few values in each column
dplyr::glimpse(raw)
Rows: 3,442
Columns: 23
$ CSBID        <chr> "091522009778739", "091522009778745", "091522009778753", …
$ CSBYEARS     <chr> "1522", "1522", "1522", "1522", "1522", "1522", "1522", "…
$ CSBACRES     <dbl> 2.561646, 4.998030, 4.605023, 3.764729, 2.659328, 12.1047…
$ R15          <int> 222, 176, 37, 37, 61, 222, 36, 61, 1, 36, 61, 36, 222, 22…
$ R16          <int> 61, 37, 37, 37, 37, 61, 36, 61, 61, 36, 12, 36, 12, 61, 3…
$ R17          <int> 11, 37, 37, 37, 37, 1, 37, 1, 1, 36, 27, 37, 1, 11, 36, 3…
$ R18          <int> 11, 37, 37, 37, 37, 1, 37, 1, 37, 37, 1, 37, 1, 1, 36, 37…
$ R19          <int> 11, 37, 37, 37, 176, 11, 1, 11, 37, 37, 61, 37, 12, 11, 3…
$ R20          <int> 11, 37, 37, 37, 1, 11, 1, 11, 37, 37, 11, 37, 11, 11, 37,…
$ R21          <int> 11, 176, 37, 37, 1, 11, 176, 11, 1, 37, 11, 37, 12, 11, 3…
$ R22          <int> 11, 176, 37, 37, 1, 11, 176, 11, 1, 37, 11, 176, 43, 11, …
$ STATEASD     <chr> "0910", "0910", "0910", "0910", "0910", "0910", "0910", "…
$ ASD          <chr> "10", "10", "10", "10", "10", "10", "10", "10", "10", "10…
$ CNTY         <chr> "Hartford", "Hartford", "Hartford", "Hartford", "Hartford…
$ CNTYFIPS     <chr> "003", "003", "003", "003", "003", "003", "003", "003", "…
$ INSIDE_X     <dbl> 1895864, 1882887, 1884842, 1895255, 1896851, 1897364, 189…
$ INSIDE_Y     <dbl> 2348512, 2345240, 2345735, 2348269, 2348659, 2348843, 234…
$ Shape_Leng   <dbl> NA, NA, NA, NA, NA, NA, NA, NA, NA, NA, NA, NA, NA, NA, N…
$ Shape_Length <dbl> 517.9627, 797.8349, 628.0148, 781.6467, 477.5219, 1433.17…
$ Shape_Area   <dbl> 10366.61, 20226.31, 18635.87, 15235.32, 10761.92, 48986.1…
$ year         <int> 2022, 2022, 2022, 2022, 2022, 2022, 2022, 2022, 2022, 202…
$ STATEFIPS    <int> 9, 9, 9, 9, 9, 9, 9, 9, 9, 9, 9, 9, 9, 9, 9, 9, 9, 9, 9, …
$ geometry     <MULTIPOLYGON [m]> MULTIPOLYGON (((1895891 234..., MULTIPOLYGON…
In looking through the list of columns and first few rows of data in each column, it appears that there is a unique identifier for each field (CSBID), crop codes for a given year for that field (R15 … R22), and additional fields that describe the polygon (i.e., crop sequence boundary). The crop codes aren’t particularly useful to us; instead, we need to find out which actual crop each of those codes actually represents (i.e., we need a look-up table).

Unfortunately, the crop codes metadata is stored in an ugly XML file, but our team took the time to create a crop codes lookup table in .csv format for your convenience.

Code
library(knitr)

# Read in the crop codes lookup table
lookup <- read.csv(
  file = "https://raw.githubusercontent.com/ketchbrookanalytics/usda-csb-data/main/data/crop_types.csv",
  colClasses = c("integer", "character"),
  strip.white = TRUE
)

# Take a look at the first few rows of the crop codes lookup table
head(lookup) |> 
  knitr::kable(align = c("c", "l"))
categorization_code land_cover
0 Background
1 Corn
2 Cotton
3 Rice
4 Sorghum
5 Soybeans

Now, let’s replace the integer codes in the original CSB data with the descriptions from the look-up table.

Code
# Create a helper function to replace the crop code integer values with the 
# plain-English descriptions
lookup_codes <- function(var, codes) {

  codes$land_cover[match(x = {{ var }}, table = codes$categorization_code)]

}

# Replace the integer codes in the crop rotation columns with the plain-English
# descriptions of the cover
clean <- raw |> 
  dplyr::mutate(
    dplyr::across(
      .cols = tidyselect::matches("R[0-9][0-9]"),
      .fns = function(x) lookup_codes(var = x, codes = lookup)
    )
  ) |> 
  # Rename the "R*" columns to the full year
  dplyr::rename_with(
    .fn = function(x) stringr::str_replace(x, "R", "20"),
    .cols = tidyselect::matches("R[0-9][0-9]")
  )

We can take a look at how the crop cover changed for a few individual geometries (crop sequence boundaries) between 2020 and 2022.

Code
clean |> 
  sf::st_drop_geometry() |> 
  dplyr::select(CSBID, `2020`:`2022`) |> 
  dplyr::slice(6:10) |> 
  knitr::kable()
CSBID 2020 2021 2022
091522009778764 Tobacco Tobacco Tobacco
091522009778766 Corn Grassland/Pasture Grassland/Pasture
091522009778773 Tobacco Tobacco Tobacco
091522009778774 Other Hay/Non Alfalfa Corn Corn
091522009778776 Other Hay/Non Alfalfa Other Hay/Non Alfalfa Other Hay/Non Alfalfa

Data Visualization

Once we’ve calculated some summary statistics about our data and developed a few tables, a logical next step might be to start visualizing the data in a map or chart. We can employ some static and interactive maps and charts to help us gain a better understanding of the crop sequence boundary data.

Static Maps

Perhaps you know that the {ggplot2} library is great for developing static charts, but did you know it can produce beautiful maps, too? Here’s a chart showing the crop type in each individual geometry (i.e., crop sequence boundary) in Hartford County, Connecticut.

Code
library(ggplot2)

clean |> 
  ggplot2::ggplot(
    ggplot2::aes(fill = `2022`)
  ) + 
  ggplot2::geom_sf() + 
  ggplot2::labs(
    title = "Crop Cover Map (2022)",
    subtitle = "Hartford County, Connecticut"
  ) +
  ggplot2::theme(
    legend.position = "top",
    legend.title = ggplot2::element_blank()
  )

Interactive Maps

While {ggplot2} is great for static visuals, {leaflet} maps are handy for interactive visualizations that can be embed in any HTML document or webpage. But before we make a {leaflet} map, let’s find out which crops are most prevalent in Hartford County.

Code
top_3 <- clean |> 
  sf::st_drop_geometry() |> 
  dplyr::count(Crop = `2022`, name = "Count", sort = TRUE) |> 
  dplyr::slice_head(n = 3)

top_3 |> 
  knitr::kable(
    format.arg = list(NULL, big.mark = ","),
    caption = "Top 3 Crop Types in Hartford County (2022)"
  )
Top 3 Crop Types in Hartford County (2022)
Crop Count
Other Hay/Non Alfalfa 1,155
Corn 870
Grassland/Pasture 657

The top three types of crop are above. Let’s filter our dataframe to include only those, and eliminate extra fields we won’t need now.

Code
for_leaflet <- clean |> 
  dplyr::filter(
    `2022` %in% top_3$Crop
  ) |> 
  dplyr::select(
    CSBID, 
    Crop = `2022`, 
    Shape_Area
  ) |> 
  # convert sq. meters to acres
  dplyr::mutate(Shape_Area = round(Shape_Area / 4046.85642)) |> 
  sf::st_transform(4326)

Our data prep is done – time to make an interactive map!

Code
library(leaflet)

# Create separate data frames for each layer (crop) for our map
hay <- for_leaflet |> 
  dplyr::filter(Crop == "Other Hay/Non Alfalfa")

grass <- for_leaflet |> 
  dplyr::filter(Crop == "Grassland/Pasture")

corn <- for_leaflet |> 
  dplyr::filter(Crop == "Corn")

# Create palettes for each map
pal_hay <- leaflet::colorNumeric(
  palette = "viridis",
  domain = hay$Shape_Area
)

pal_grass <- leaflet::colorNumeric(
  palette = "viridis",
  domain = grass$Shape_Area
)

pal_corn <- leaflet::colorNumeric(
  palette = "viridis",
  domain = corn$Shape_Area
)

# Create HTML popups
popup_hay <- paste0(
  "Crop: ", "Other Hay/Non Alfalfa", "<br>",
  "Acres: ", hay$Shape_Area
)

popup_grass <- paste0(
  "Crop: ", "Grassland/Pasture", "<br>",
  "Acres: ", grass$Shape_Area
)

popup_corn <- paste0(
  "Crop: ", "Corn", "<br>",
  "Acres: ", corn$Shape_Area
)

# Create the leaflet map
leaflet::leaflet() |> 
  leaflet::addProviderTiles(
    provider = leaflet::providers$Esri.WorldTopoMap
  ) |> 
  leaflet::addPolygons(
    data = hay, 
    fillColor = ~pal_hay(Shape_Area), 
    color = "#b2aeae", # you need to use hex colors
    fillOpacity = 0.8, 
    weight = 1, 
    smoothFactor = 0.2,
    group = "Other Hay/Non Alfalfa",
    popup = popup_hay
  ) |> 
  leaflet::addPolygons(
    data = grass, 
    fillColor = ~pal_grass(Shape_Area), 
    color = "#b2aeae", # you need to use hex colors
    fillOpacity = 0.8, 
    weight = 1, 
    smoothFactor = 0.2,
    group = "Grassland/Pasture",
    popup = popup_grass
  ) |> 
  leaflet::addPolygons(
    data = corn, 
    fillColor = ~pal_corn(Shape_Area), 
    color = "#b2aeae", # you need to use hex colors
    fillOpacity = 0.8, 
    weight = 1, 
    smoothFactor = 0.2,
    group = "Corn",
    popup = popup_corn
  ) |> 
  leaflet::addLayersControl(
    overlayGroups = c(
      "Other Hay/Non Alfalfa",
      "Grassland/Pasture",
      "Corn"
    ),
    options = leaflet::layersControlOptions(collapsed = FALSE)
  ) |> 
  leaflet::hideGroup(c("Grassland/Pasture", "Corn"))  |> 
  leaflet::showGroup("Other Hay/Non Alfalfa") |> 
  leaflet::setView(lng = -72.552, lat = 41.992, zoom = 12)
Leaflet | Tiles © Esri — Esri, DeLorme, NAVTEQ, TomTom, Intermap, iPC, USGS, FAO, NPS, NRCAN, GeoBase, Kadaster NL, Ordnance Survey, Esri Japan, METI, Esri China (Hong Kong), and the GIS User Community

Click on a shape on the map to see the type of crop & acreage in each CSB

Faceted Bar Charts

Maybe we don’t care as much about the geometries within the data, but are more interested in the finding trends over time. For example, we could summarize the top five crops for the last four years in the data set. We can return back to {ggplot2} to make faceted bar charts that can illustrate these trends.

Code
library(tidyr)

clean |> 
  sf::st_drop_geometry() |> 
  tidyr::pivot_longer(
    cols = starts_with("20"),
    names_to = "crop_year",
    values_to = "crop"
  ) |> 
  dplyr::filter(
    crop_year >= 2019
  ) |> 
  dplyr::group_by(crop_year, crop) |> 
  dplyr::summarise(
    `Total Acres` = round(sum(Shape_Area)),
    .groups = "drop"
  ) |> 
  dplyr::arrange(crop_year, dplyr::desc(`Total Acres`)) |> 
  dplyr::slice_head(n = 5L, by = crop_year) |> 
  ggplot2::ggplot(
    ggplot2::aes(
      x = reorder(crop, `Total Acres`),
      y = `Total Acres`,
      fill = crop
    )
  ) + 
  ggplot2::geom_col() + 
  ggplot2::scale_y_continuous(
    labels = scales::label_comma(
      scale = 1 / 1000000, 
      suffix = "M"
    ),
  ) +
  ggplot2::scale_color_brewer(palette = "viridis") +
  ggplot2::coord_flip() + 
  ggplot2::facet_wrap(~ crop_year, scales = "free_y") + 
  ggplot2::labs(
    title = "Top 5 Crops by Year",
    subtitle = "Based upon Total CSB Area (in Acres)"
  ) + 
  ggplot2::theme(
    axis.text.x = ggplot2::element_text(angle = 60, vjust = 1, hjust=1),
    axis.title.y = ggplot2::element_blank(),
    legend.position = "none",
    panel.background = ggplot2::element_blank(),
    panel.border = ggplot2::element_rect(fill = NA, color = "black")
  )

What’s Next?

So now that you know this data exists, where can you go from here?

Analyze the Data Yourself!

We encourage you to use our public .parquet files of this CSB data set. All you need to do is reference the s3 bucket like so:

Code
bucket <- arrow::s3_bucket("ketchbrook-public-usda-nass-csb")

before using the framework in this article to query the data that is stored there.

A Potential Use Case

Imagine you have another geospatial dataset containing locations of the fields (literal crop fields) a producer farms. A simple geospatial join with the CSB data would provide a wealth of information on what that producer is planting this year.

Additional Resources

Lastly, here are some other additional links that you may find helpful in your journey while analyzing the CSB data:

Plotting with tidyUSDA R package

Interested in Learning More?

Get in touch with us today at info@ketchbrookanalytics.com

Footnotes

  1. We did successfully read the CSB data into QGIS without any blue screens, but this post is aimed at the R and Python crowd↩︎

  2. https://www.nass.usda.gov/Research_and_Science/Crop-Sequence-Boundaries/↩︎

  3. This link contains a helpful intro to the geoparquet format.↩︎

  4. For more information on Parquet and lazy evaluation, see our guest post on the Posit blog.↩︎